Thursday, April 12, 2012

Map #3: Federal Land Ownership in the United States


The last map I selected was created by David M. Kennedy, Professor of History at Stanford University. It shows the percentage of land owned in each state both numerically and with a smaller, red image image of the state within the actual state. What I find interesting about this map is the heavily skewed distribution. Colorado and the Rocky mountains seem to form a dividing line as far as government land ownership is concerned. While you can read about the differences in historical development and federal involvement in states, it is most striking to see the difference between the eastern and western United States in map form. I thought it was also cool how they included a smaller red image of states indicating the amount of land owned by the United States government, it makes clear just how much area 40% or more can be.

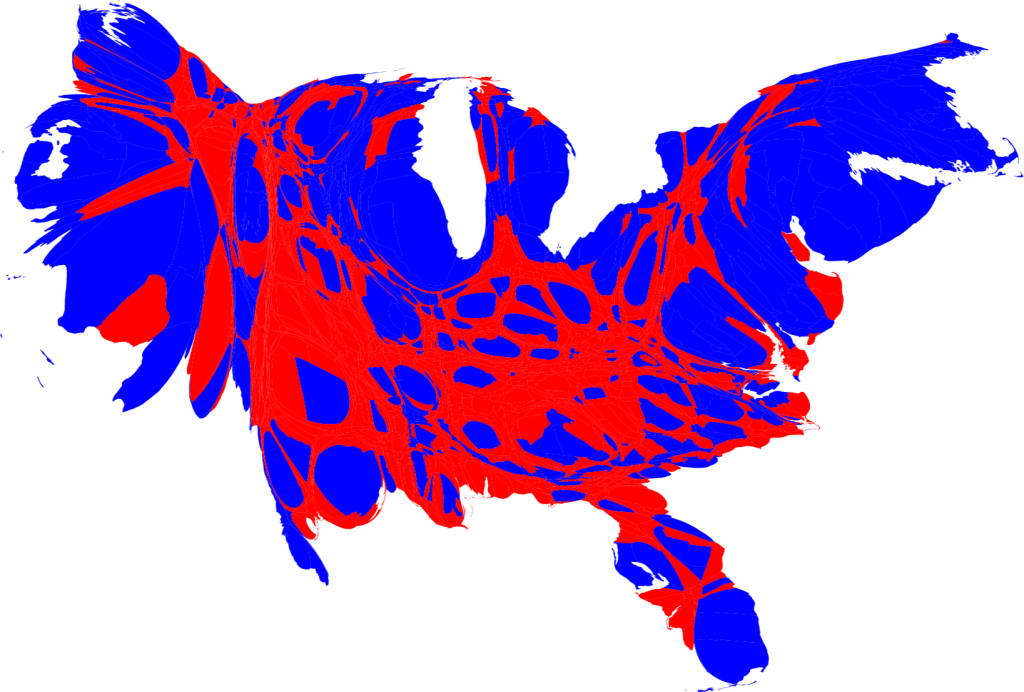
Map #2: Cartogram of the 2008 US Presidential Election


The next map I chose was created by Mark Newman, a Professor of Physics at the Center for the Study of Complex Systems at the University of Michigan. It is an area cartogram which assigns the size of each county based not on physical area, but on population. The counties are then labeled red or blue to indicate how they voted in the 2008 presidential election, blue for Barack Obama and red for John McCain. What I liked about this map was how it dispelled traditional notions about political parties in the United States. People often talk of a conservative, republican “heartland” of the country bordered by the liberal, democratic coasts. However, this map shows the large pockets of democrats within the supposedly conservative center, as well as conservatives in the coastal regions. I thought it was a very interesting way to better display the political beliefs of the actual population, as opposed to counties or states.

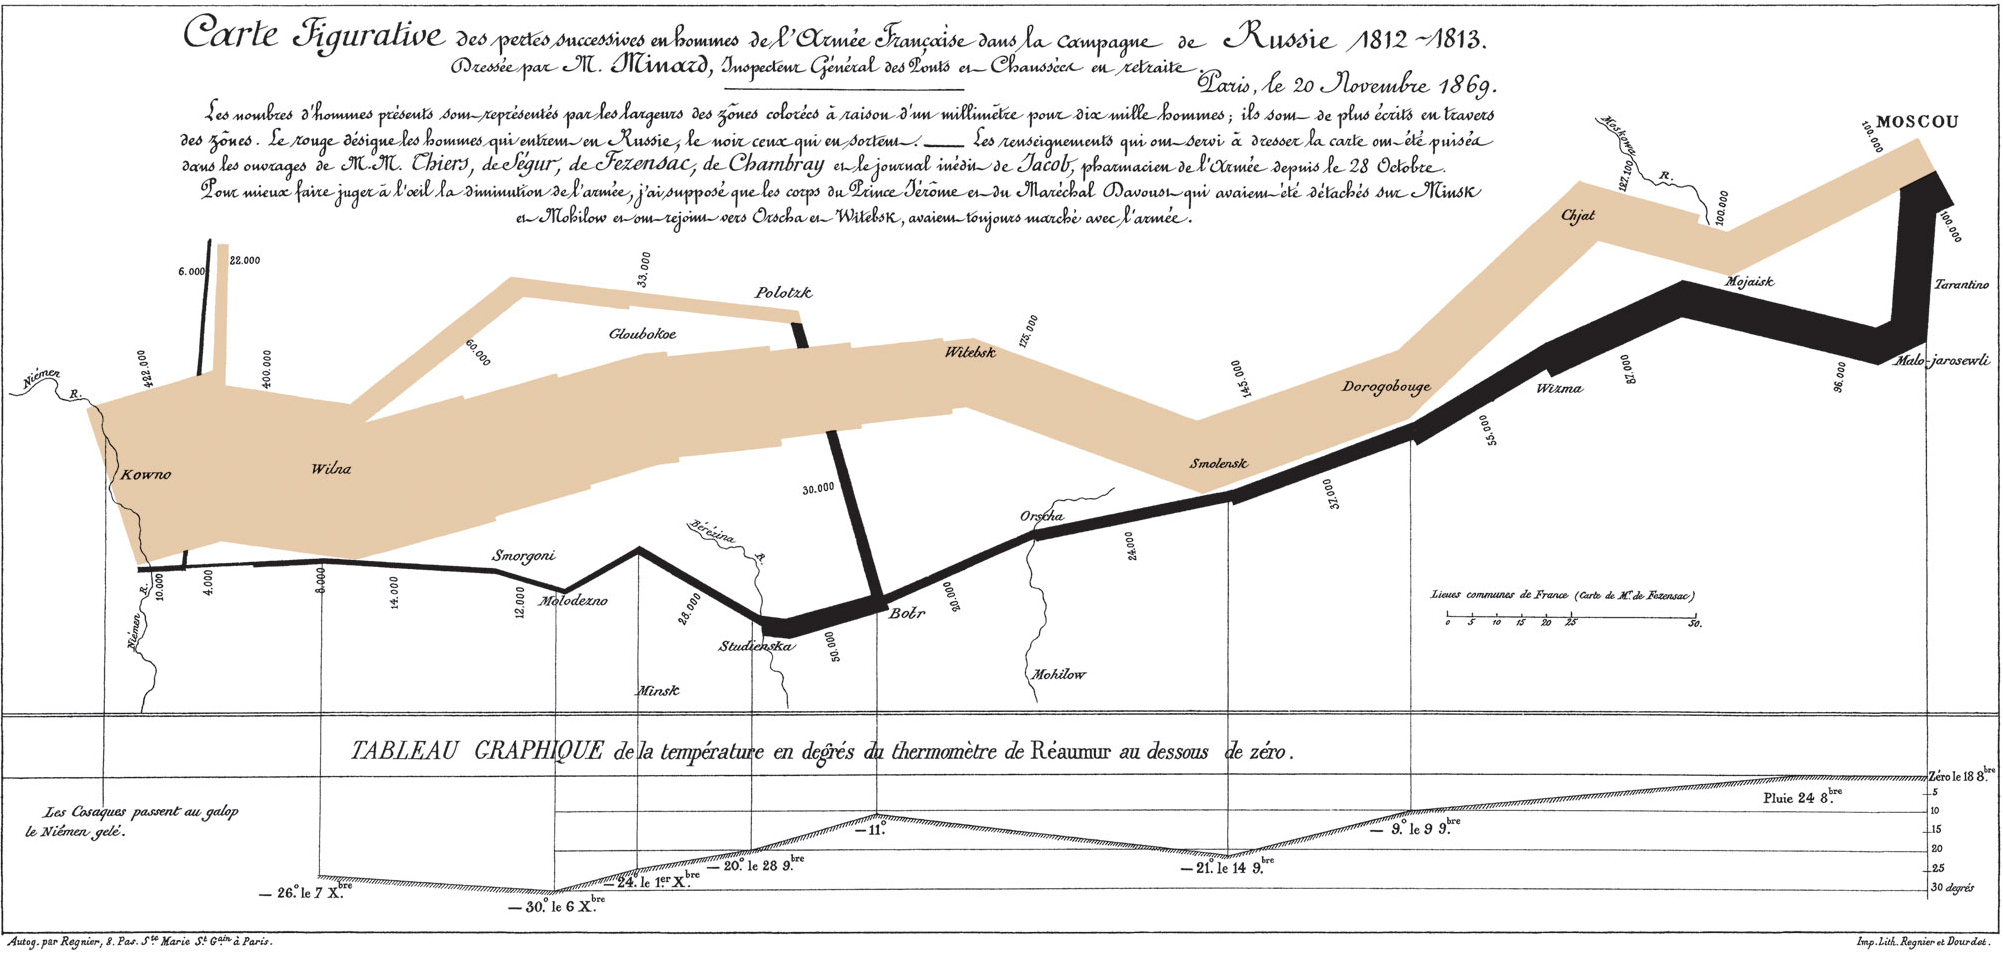
Map #1: Losses of the French Army in the Russian Campaign 1812-1813


This map, probably one of the most famous in existence, was created in 1869 by Charles Minard, a French civil engineer who also created a wide variety of maps. This one shows the disastrous result of Napoleon’s 1812-1813 Russian campaign. What I really like about this map is the wide variety of information it conveys. The colors show the direction of the army (brown invading, black retreating) overlaid on a map of Russia. In addition, the width of the line shows the size of the army, and as losses increased over time the line thinned. Numbers along the side of the line show the exact number of troops at certain points. Finally, the bottom of the map contains a temperature readout which shows the temperature at a variety of locations during the retreat. This map does an outstanding job of providing you with a variety of information that allows the viewer to   really understand what was happening as the campaign progressed: the army went deeper into Russia, losing massive amounts of men, and by the time they decided to retreat winter had come and even more men were lost. I found the way that this map told a story through the information it gave very cool, and that is why I chose it.